NetGuard
Enterprise network and infrastructure monitoring built for UK businesses. Shift from reactive firefighting to proactive intelligence with real-time diagnostics and automated alerting.
A Single Pane of Glass
Stop jumping between vendor dashboards. NetGuard unifies your entire network fabric into one clean, actionable interface.
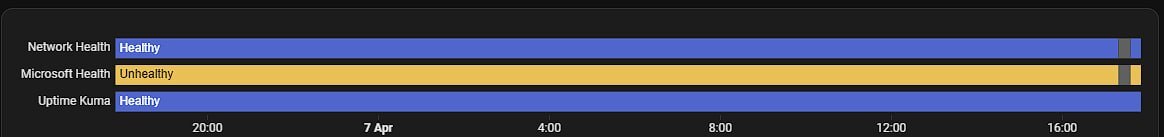
Instantly see the health of your core infrastructure—from edge switches in your Hull office to cloud services like Microsoft 365—at a glance. Our timeline view ensures you never miss a transient drop or overnight outage.
- Real-time visual timelines of network health
- Unified monitoring of LAN, WAN, and Cloud
- Long-term historical metrics for capacity planning
Actionable Diagnostics
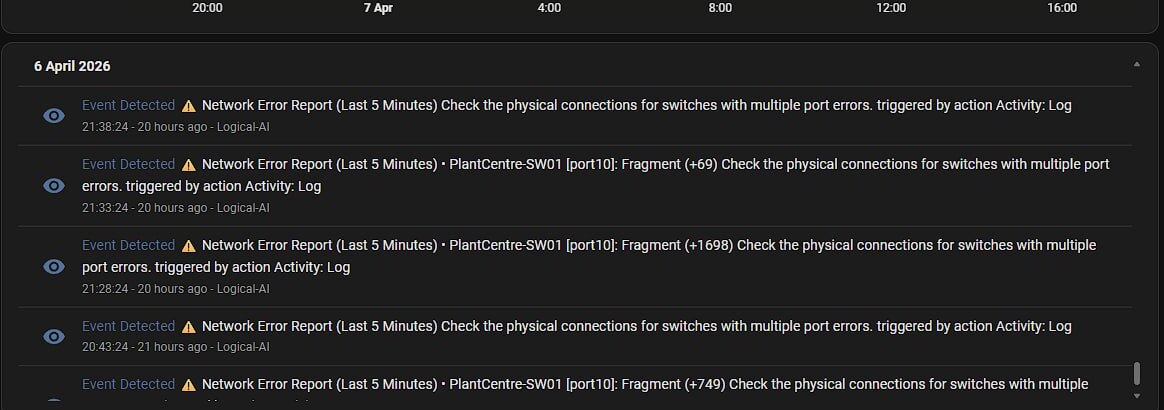
Data is useless without context. When a problem occurs, NetGuard doesn't just alert you that "something is broken"—it tells you exactly where to look.
Event Detected: Network Error Report (Last 5 Minutes) • Hull-Core-SW01 [port10]: Fragment (+1698)
Recommendation: Check the physical connections for switches with multiple port errors.
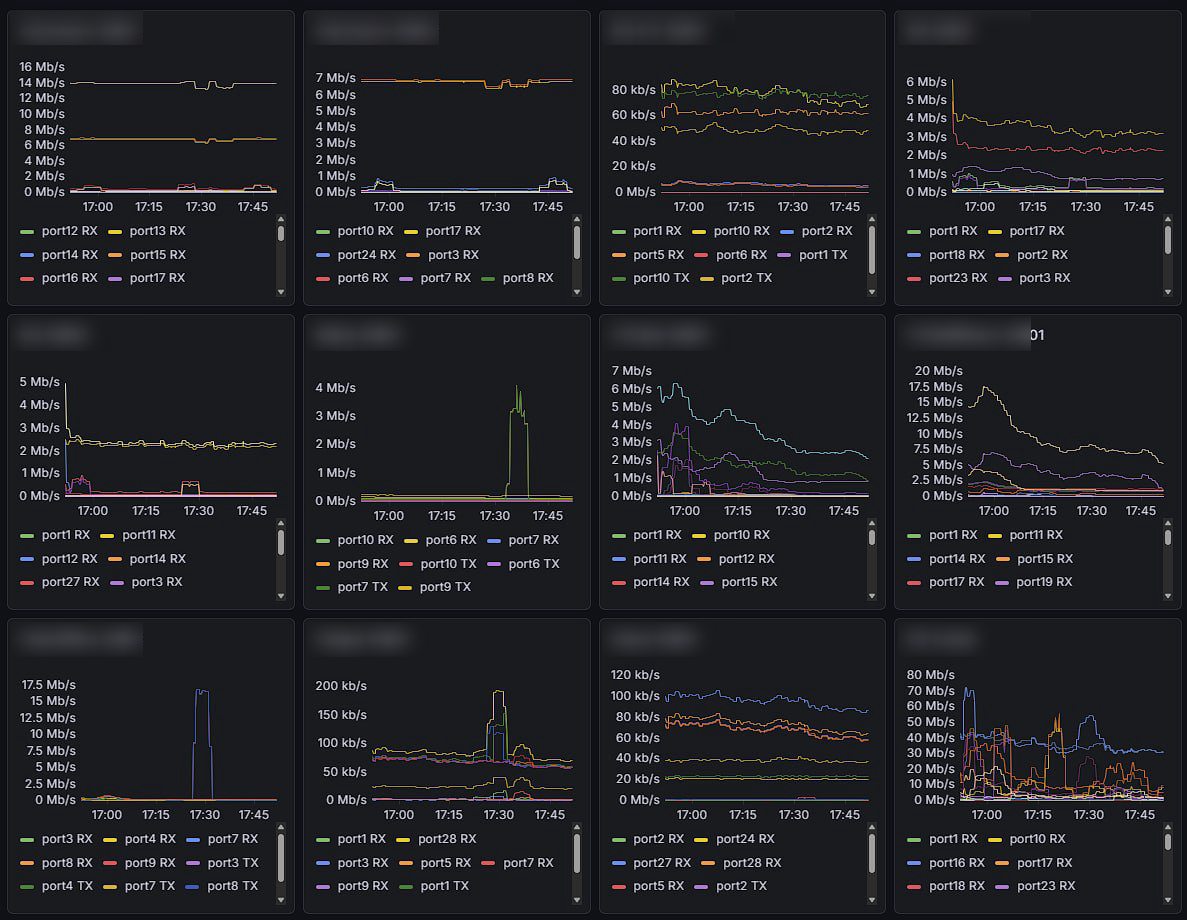
Granular Telemetry
Powered by VictoriaMetrics, NetGuard captures high-resolution, long-term statistics for every port across your entire estate. Deep-dive into bandwidth trends to pinpoint bottlenecks before they affect users.
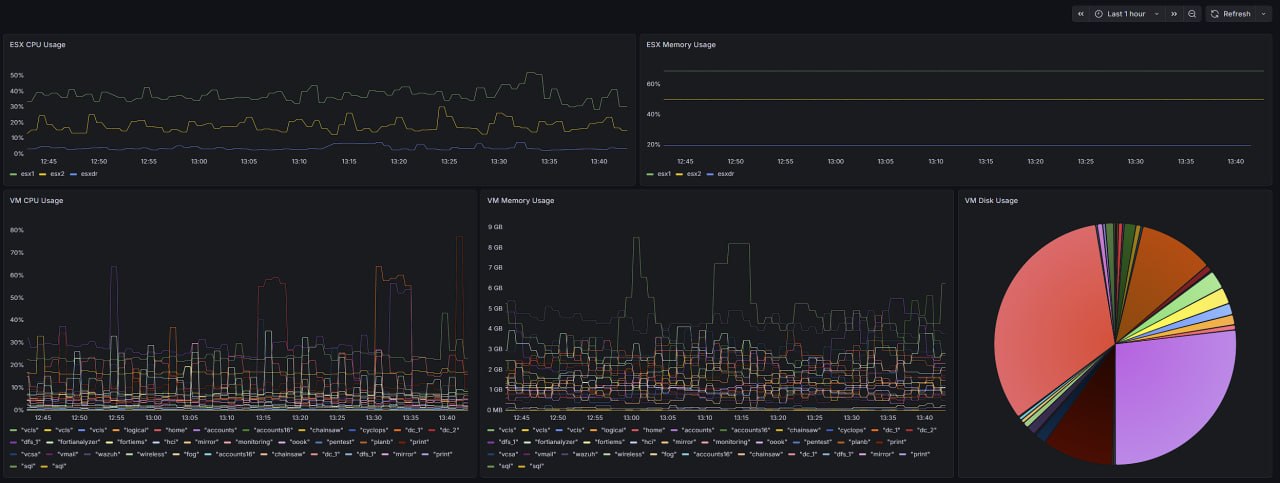
Live Server Observability
NetGuard now includes full server health monitoring. Track CPU, memory, and disk usage across your entire infrastructure, integrated directly into your network view for a truly holistic monitoring experience.
| Monitored Component | Metrics Tracked |
|---|---|
| Network Interfaces | Bandwidth, CRC Errors, Dropped Packets |
| Core Hardware | CPU Load, Memory Utilization, Temps |
| Storage Arrays | IOPS, Capacity thresholds, Disk Health |
Frequently Asked Questions
Can NetGuard monitor multiple office locations across the UK?
Yes, NetGuard provides a single pane of glass for all your sites, whether you have a single headquarters in Hull or branches spanning across the UK.
Does it alert our IT team automatically?
Absolutely. NetGuard sends actionable diagnostics detailing exactly which switch and port is failing, allowing your IT team to act proactively rather than waiting for user complaints.
Do you monitor both network hardware and cloud services?
Yes, we monitor physical edge switches, internal server infrastructure, and essential cloud services like Microsoft 365 in one unified dashboard.